The data collected by any meter can be downloaded in CSV (Microsoft Excel) format to be manipulated/displayed for offline use. By clicking "Download Data" and then selecting the interval type, the CSV file will be downloaded locally. "Selected Intervals" will download the meter data in the graph interval selected.
Each file downloaded will follow the naming convention as "SUMS DD-MM-YY.csv".
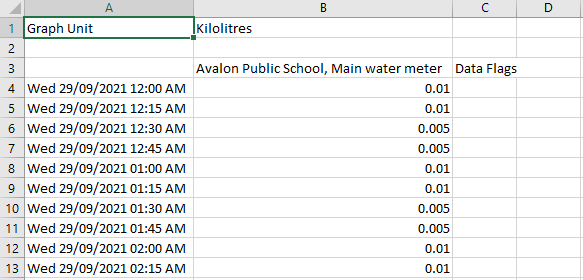
Below is an example file downloaded in 15-minute intervals.
Meter data can similarly be viewed in a table. By clicking "Download Data" and then "Show Data", a popup of the meter data will appear.
The charts displayed in SUMS can also be downloaded as a jpeg, or directly printed by clicking "Download Data" and then either "Save Chart" or "Print Chart".